1 Introduction to SPSS
(PSY206) Data Management and Analysis
1 SPSS Background
1.1 Introduction to SPSS
- SPSS (Statistical Package for the Social Sciences) is one of the most widely used statistical software programs.
- Originally developed in the late 1960s, it is now owned by IBM and officially called IBM SPSS Statistics.
- Commonly used in social sciences, psychology, health, education, business, and market research.
- Provides two modes of working:
- Menu-driven interface (point-and-click) – easy for beginners.
- Syntax (command language) – ensures reproducibility for advanced users.
- Menu-driven interface (point-and-click) – easy for beginners.
- SPSS include data visualization, advanced statistical tests, predictive models, and reporting tools.
1.2 Why SPSS Became Popular
- Ease of Use: Point-and-click interface makes it accessible to beginners without coding.
- Reproducibility: Syntax editor allows advanced users to document and repeat analyses.
- Versatility: Handles descriptive statistics, hypothesis testing, regression, multivariate methods, and time-series analysis.
- Integration: Can import/export data from Excel, CSV, Stata, SAS, and other formats.
- Professional Output: Produces clean, well-formatted tables and charts ready for reports or publications.
- Wide Acceptance: Adopted by universities, NGOs, and government agencies worldwide, especially in survey and behavioral research.
- Consistency and Reliability: Established a reputation for stable, trusted results, making it a standard in academic and applied fields.
Example: A public health researcher can quickly import survey data, run chi-square tests, and generate graphs for a report, all without programming, demonstrating why SPSS became a preferred tool.
1.3 Applications of SPSS
- Data Management
- Data entry and cleaning.
- Handling missing values.
- Recoding and computing new variables.
- Data entry and cleaning.
- Descriptive Statistics
- Frequency tables and cross-tabulations.
- Mean, median, mode, variance, standard deviation.
- Frequency tables and cross-tabulations.
- Inferential Statistics
- Hypothesis testing (t-test, chi-square, ANOVA).
- Correlation and regression.
- Logistic regression and non-parametric tests.
- Hypothesis testing (t-test, chi-square, ANOVA).
- Advanced Analysis
- Factor analysis, PCA, and reliability analysis.
- Multivariate methods (MANOVA, discriminant analysis).
- Time-series forecasting (ARIMA, exponential smoothing).
- Factor analysis, PCA, and reliability analysis.
- Visualization
- Charts and graphs (bar charts, histograms, scatter plots).
- Boxplots and cluster plots.
- Pivot tables for summaries.
- Charts and graphs (bar charts, histograms, scatter plots).
1.4 Limitations of SPSS
- Proprietary software requiring a commercial license.
- Less flexible than open-source tools such as R and Python.
- Can be slower when handling very large datasets.
- Limited support for modern machine learning and AI applications.
For advanced statistical programming and predictive modeling, R and Python are often preferred, while SPSS remains an excellent choice for classical statistical analysis.
2 Starting SPSS
At first, download and install the SPSS installer from the IBM SPSS website (license purchase required).
To launch SPSS Statistics on a Windows computer:
Start Menu > All Programs > IBM SPSS Statistics > IBM SPSS Statistics 31
When SPSS starts for the first time, you will see an initial dialog box.
This dialog asks you whether you want to:
- Open a recently used file, or
- Open another file from your computer, or
- Create a new file from scratch.
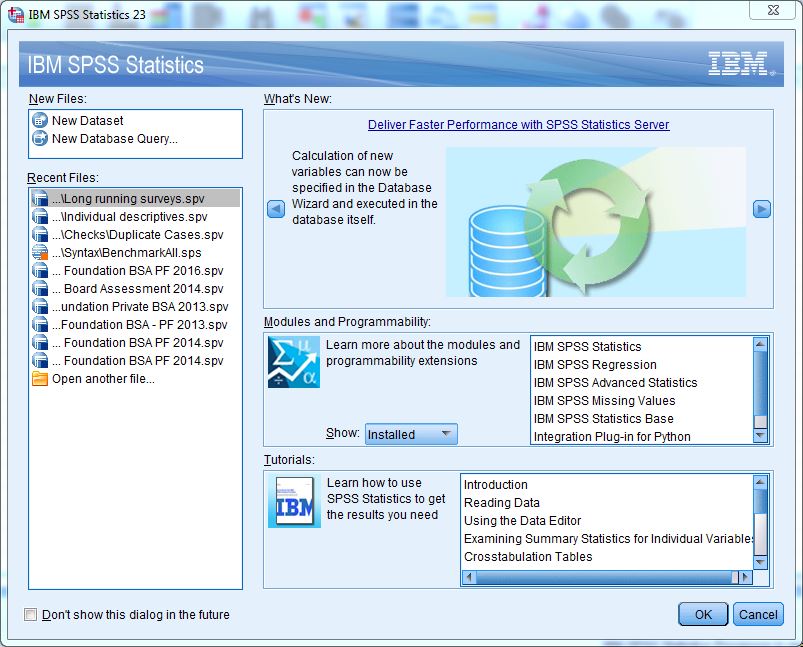
In most cases, you will begin an SPSS session by either:
- opening an existing data file, or
- creating a new dataset.
2.1 Three Main Windows in SPSS
SPSS Statistics works through three main windows, plus a menu bar at the top.
These windows allow you to:
- Enter and view your data,
- View the statistical results,
- Write or run commands.
Each of these windows is linked to a different SPSS file type.
2.2 Data Editor Window (.sav files)
The Data Editor is where you enter, edit, and view your dataset.
The Data Editor gives you two views of your data set: a Data View and a Variable View, selected by clicking on the appropriate tab in the lower left corner of the window.
- Data View
- Looks like a spreadsheet.
- Rows = individual cases (e.g., each respondent, household, or patient).
- Columns = variables (e.g., age, gender, income, education).
- You can type directly into cells or paste data from Excel.
- Looks like a spreadsheet.
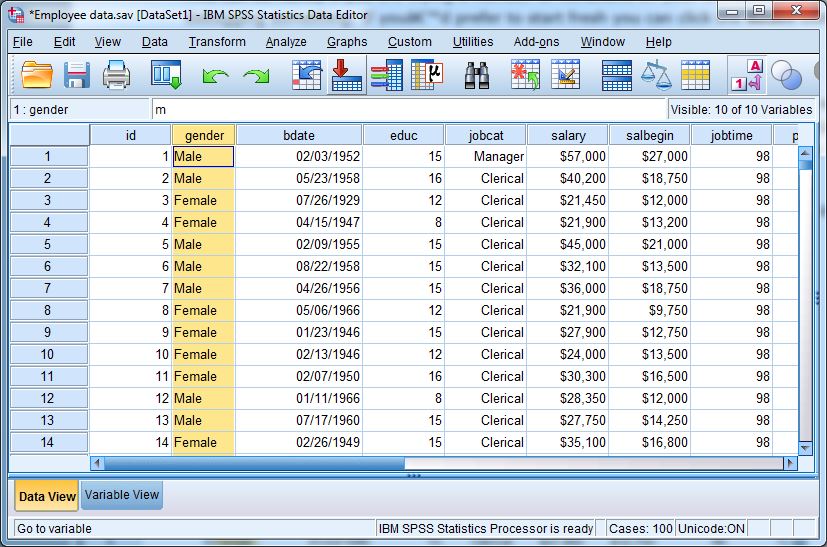
Example: If you are analyzing 100 students’ exam marks, each row represents one student, and each column represents a variable (such as ID, Gender, Exam_Score).
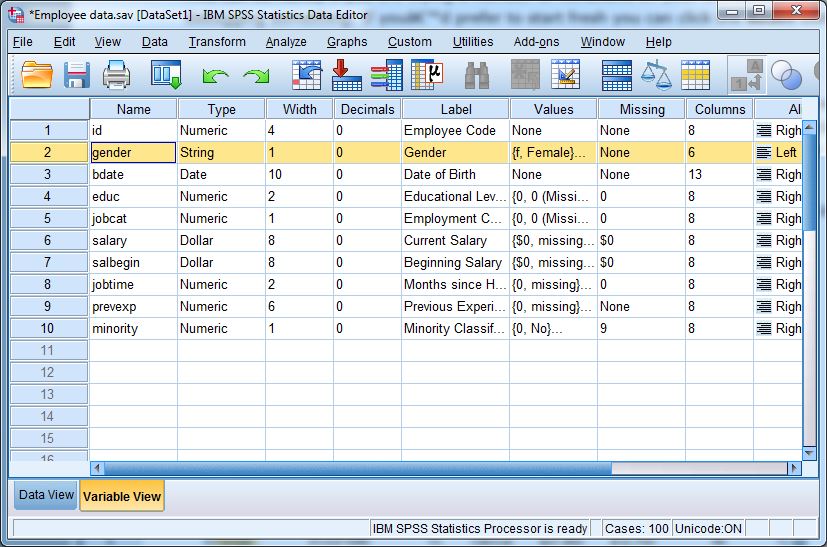
- Variable View
- Used to define and manage variables.
- Columns in Variable View include:
- Name: short name of the variable (no spaces allowed).
- Type: numeric, string, date, etc.
- Label: descriptive label for the variable.
- Values: codes and labels (e.g., 1 = Male, 2 = Female).
- Measure: nominal, ordinal, or scale.
- Name: short name of the variable (no spaces allowed).
- Important for ensuring your data is analyzed correctly.
- Used to define and manage variables.
2.3 Output Viewer Window (.spv files)
- This is where the results of your analysis appear.
- It includes tables, charts, and statistical test results.
- You can copy results into Word or PowerPoint for reports, or export them to PDF, Excel, or HTML.
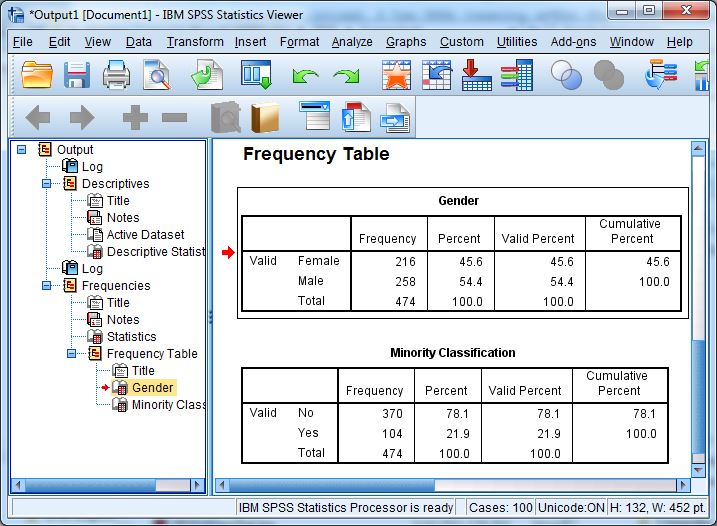
Example: After running a frequency analysis on the variable “Gender”, a table will appear in the Output Viewer showing the number and percentage of males and females.
2.4 Syntax Editor Window (.sps files)
The Syntax Editor is used to write and run commands in the SPSS command language.
Syntax is particularly useful when:
- The same analysis needs to be repeated.
- An analysis needs to be documented.
- A researcher wants a reproducible workflow.
- Many analyses need to be performed.
- A procedure is easier to specify through commands than through menus.
SPSS syntax files normally use the .sps extension.
The following command produces a frequency table for Gender:
FREQUENCIES VARIABLES=Gender.Instead of repeatedly navigating through menus, the command can be saved and run again whenever needed.
2.5 Other Windows
- Chart Editor: lets you modify graphs (e.g., change colors, add titles, edit axes).
- Pivot Table Editor: allows you to reformat output tables (change fonts, merge cells, add totals).
These editors are powerful tools for preparing results for reports or publications.
2.6 Advantages of SPSS’s Window System
- Clear separation of data, metadata, and results helps you stay organized.
- Very beginner-friendly because of its graphical interface.
- Offers flexibility:
- Point-and-click menus for beginners,
- Syntax commands for advanced users and reproducibility.
- Point-and-click menus for beginners,
2.7 File Types in SPSS
| Extension | File Type | Contents |
|---|---|---|
.sav |
Data File | Contains data + variable definitions |
.sps |
Syntax File | Stores analysis commands/scripts |
.spv |
Output File | Stores results of statistical analyses |
Note: .sav files are the most commonly used. If you only save your output (.spv), you won’t be able to re-run your analysis later without the data file.
2.8 Example Exercise
Question: Match each SPSS component with its main purpose.
- Entering and editing observations → ?
- Defining variable properties → ?
- Viewing statistical results → ?
- Writing and running SPSS commands → ?
Answer:
- Data Editor: Data View
- Data Editor: Variable View
- Output Viewer
- Syntax Editor
2.9 Summary
- SPSS (IBM SPSS Statistics) is a widely used statistical software package.
- It is particularly popular in social sciences, health, education, business, and survey research.
- SPSS provides both:
- Point-and-click menus, and
- Syntax commands.
- The Data Editor contains:
- Data View for entering and viewing observations.
- Variable View for defining variables.
- The Output Viewer displays statistical results.
- The Syntax Editor is used to write and run SPSS commands.
- SPSS uses different file types for different purposes:
.sav→ data.sps→ syntax.spv→ output
- A good SPSS workflow keeps data, syntax, and output organised separately.
- SPSS is especially useful for learning and applying classical statistical methods through a user-friendly interface.