| Software | License | Interface | Typical Applications | Key Strengths |
|---|---|---|---|---|
| SPSS | Proprietary | GUI + Syntax | Social sciences, psychology, health | Easy to learn; comprehensive statistical procedures; publication-ready output |
| R | Open Source | Programming | Statistical research, data analysis | Free; highly flexible; extensive package ecosystem |
| Python | Open Source | Programming | Data science, machine learning | General-purpose programming; automation; AI applications |
| Stata | Proprietary | GUI + Syntax | Economics, epidemiology | Strong econometrics and panel data analysis |
| SAS | Proprietary | Programming | Clinical research, industry | Handles large datasets; widely used in regulated industries |
| Why SPSS in this course? SPSS provides an intuitive graphical interface and a wide range of statistical procedures, allowing students to focus on learning statistical concepts before moving to programming-based tools such as R or Python. | ||||
0 Software Basics
(PSY206) Data Management and Analysis
1 Word and Spreadsheet
- In data analysis, we often deal with large amounts of text, numbers, and tables.
- Two essential tools to manage these are the word processor and the spreadsheet.
- These software packages are foundational:
- Word processors help us create, format, and edit documents.
- Spreadsheets help us organize, calculate, and analyze numerical data.
- Word processors help us create, format, and edit documents.
1.1 Word Processors
- A word processor is software used for creating, editing, formatting, and printing text-based documents.
- They replaced traditional typewriters by allowing:
- Easy editing and revising of text.
- Rich formatting options (fonts, margins, headings, alignment).
- Insertion of tables, figures, footnotes, references, hyperlinks.
- Spell-checking and grammar tools.
- Easy editing and revising of text.
- Examples: Microsoft Word, Google Docs, LibreOffice Writer, Apple Pages, WPS Writer, Overleaf (LaTeX editor).
1.2 Spreadsheets
- A spreadsheet is a software application designed to organize, calculate, and analyze data in tabular form.
- Data is entered into a grid of rows and columns, forming cells.
- Each cell can contain text, numbers, or formulas.
- Spreadsheets are particularly useful for:
- Numerical analysis (budgets, statistical summaries).
- Data visualization (charts and graphs).
- Data management (sorting, filtering, and summarizing).
- Numerical analysis (budgets, statistical summaries).
- Popular spreadsheets include Microsoft Excel, Google Sheets, and LibreOffice Calc.
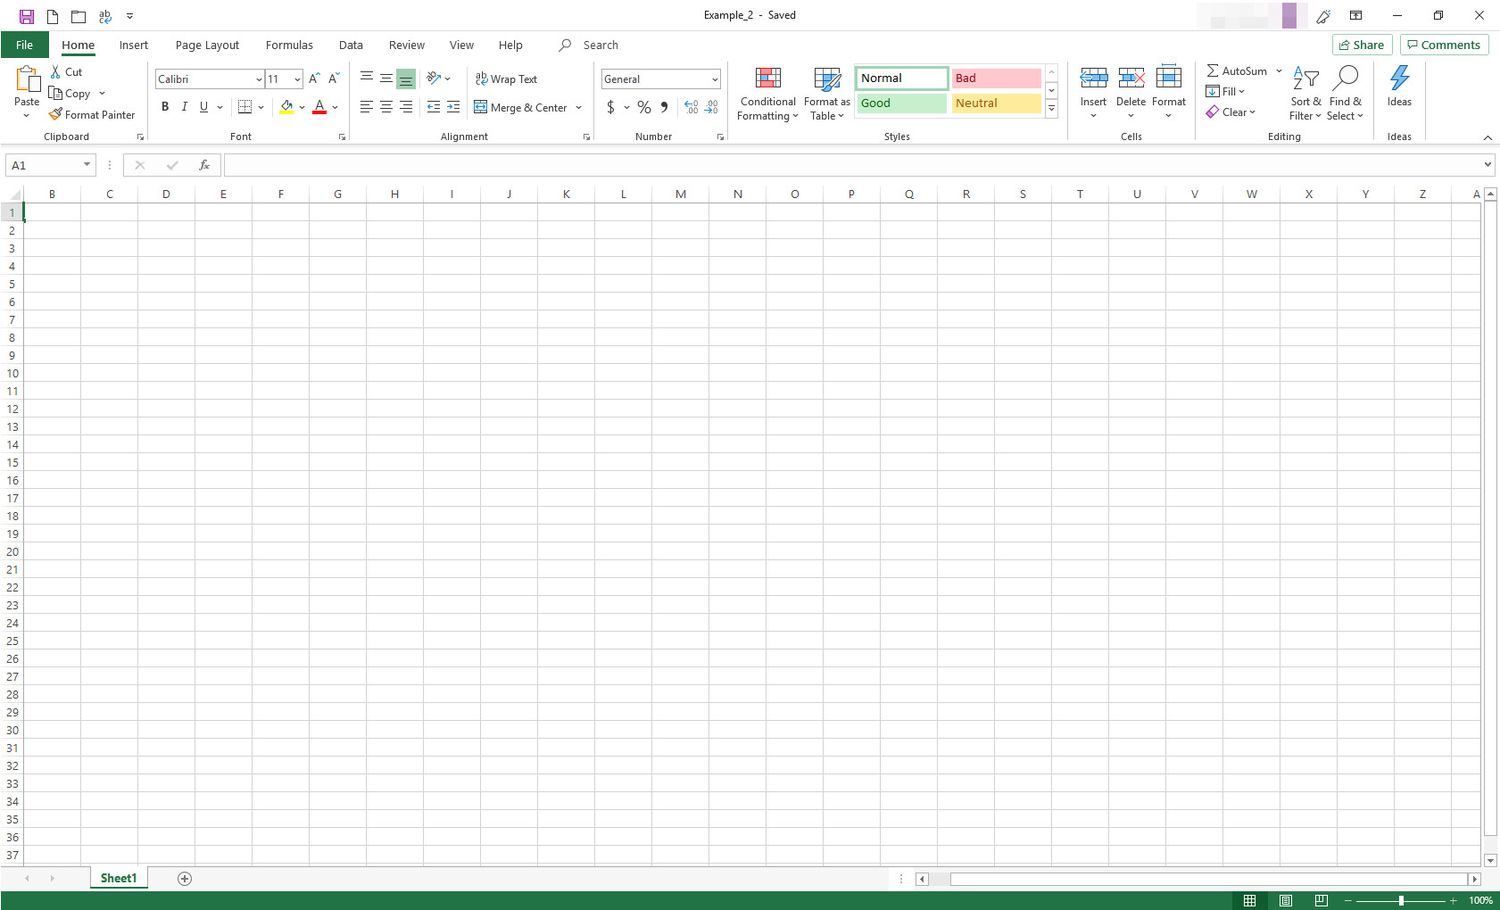
1.3 Excel Interface
- Workbook → The whole Excel file.
- Worksheet → A single tab/page inside a workbook.
- Cell → Intersection of a row and a column.
- Cell Reference:
A1= Column A, Row 1
B5= Column B, Row 5
1.4 Basic Formulas
- Always start with
=.
- Examples:
=A1 + B1→ Adds two cells.
=A1 * B1→ Multiplies values.
=A1 - B1→ Subtracts values.
=A1 / B1→ Divides values.
1.5 Common Functions
- SUM →
=SUM(A1:A5)adds all numbers from A1 to A5.
- AVERAGE →
=AVERAGE(B1:B10)finds mean.
- MAX / MIN →
=MAX(C1:C20),=MIN(C1:C20)finds maximum and minimum. - COUNT →
=COUNT(D1:D50)counts numeric entries.
1.6 Formatting Data
- Change font, size, and color.
- Use bold/italic/underline for emphasis.
- Align text left, right, or center.
- Format numbers as:
- Currency
- Percentage
- Date
- Currency
2 Statistical Software Overview
- In modern research, as data analysis becomes larger and more complex, specialized statistical software has become essential.
- These tools help researchers and students:
- Manage and clean large datasets efficiently.
- Perform statistical tests, modeling, and predictive analysis.
- Create professional-quality graphs and formatted reports.
- Manage and clean large datasets efficiently.
- Each software package has its own strengths and weaknesses, and the choice often depends on:
- Field of study,
- Research objectives,
- Budget,
- Familiarity with coding.
- Field of study,
2.1 Open-Source vs. Proprietary Software
Statistical software can also be classified based on its licensing model.
| Open-Source Software | Proprietary Software |
|---|---|
| Source code is publicly available. | Source code is not publicly available. |
| Usually free to use, modify, and distribute. | Requires purchasing a license or subscription. |
| Developed and improved by a community of contributors. | Developed and maintained by a company. |
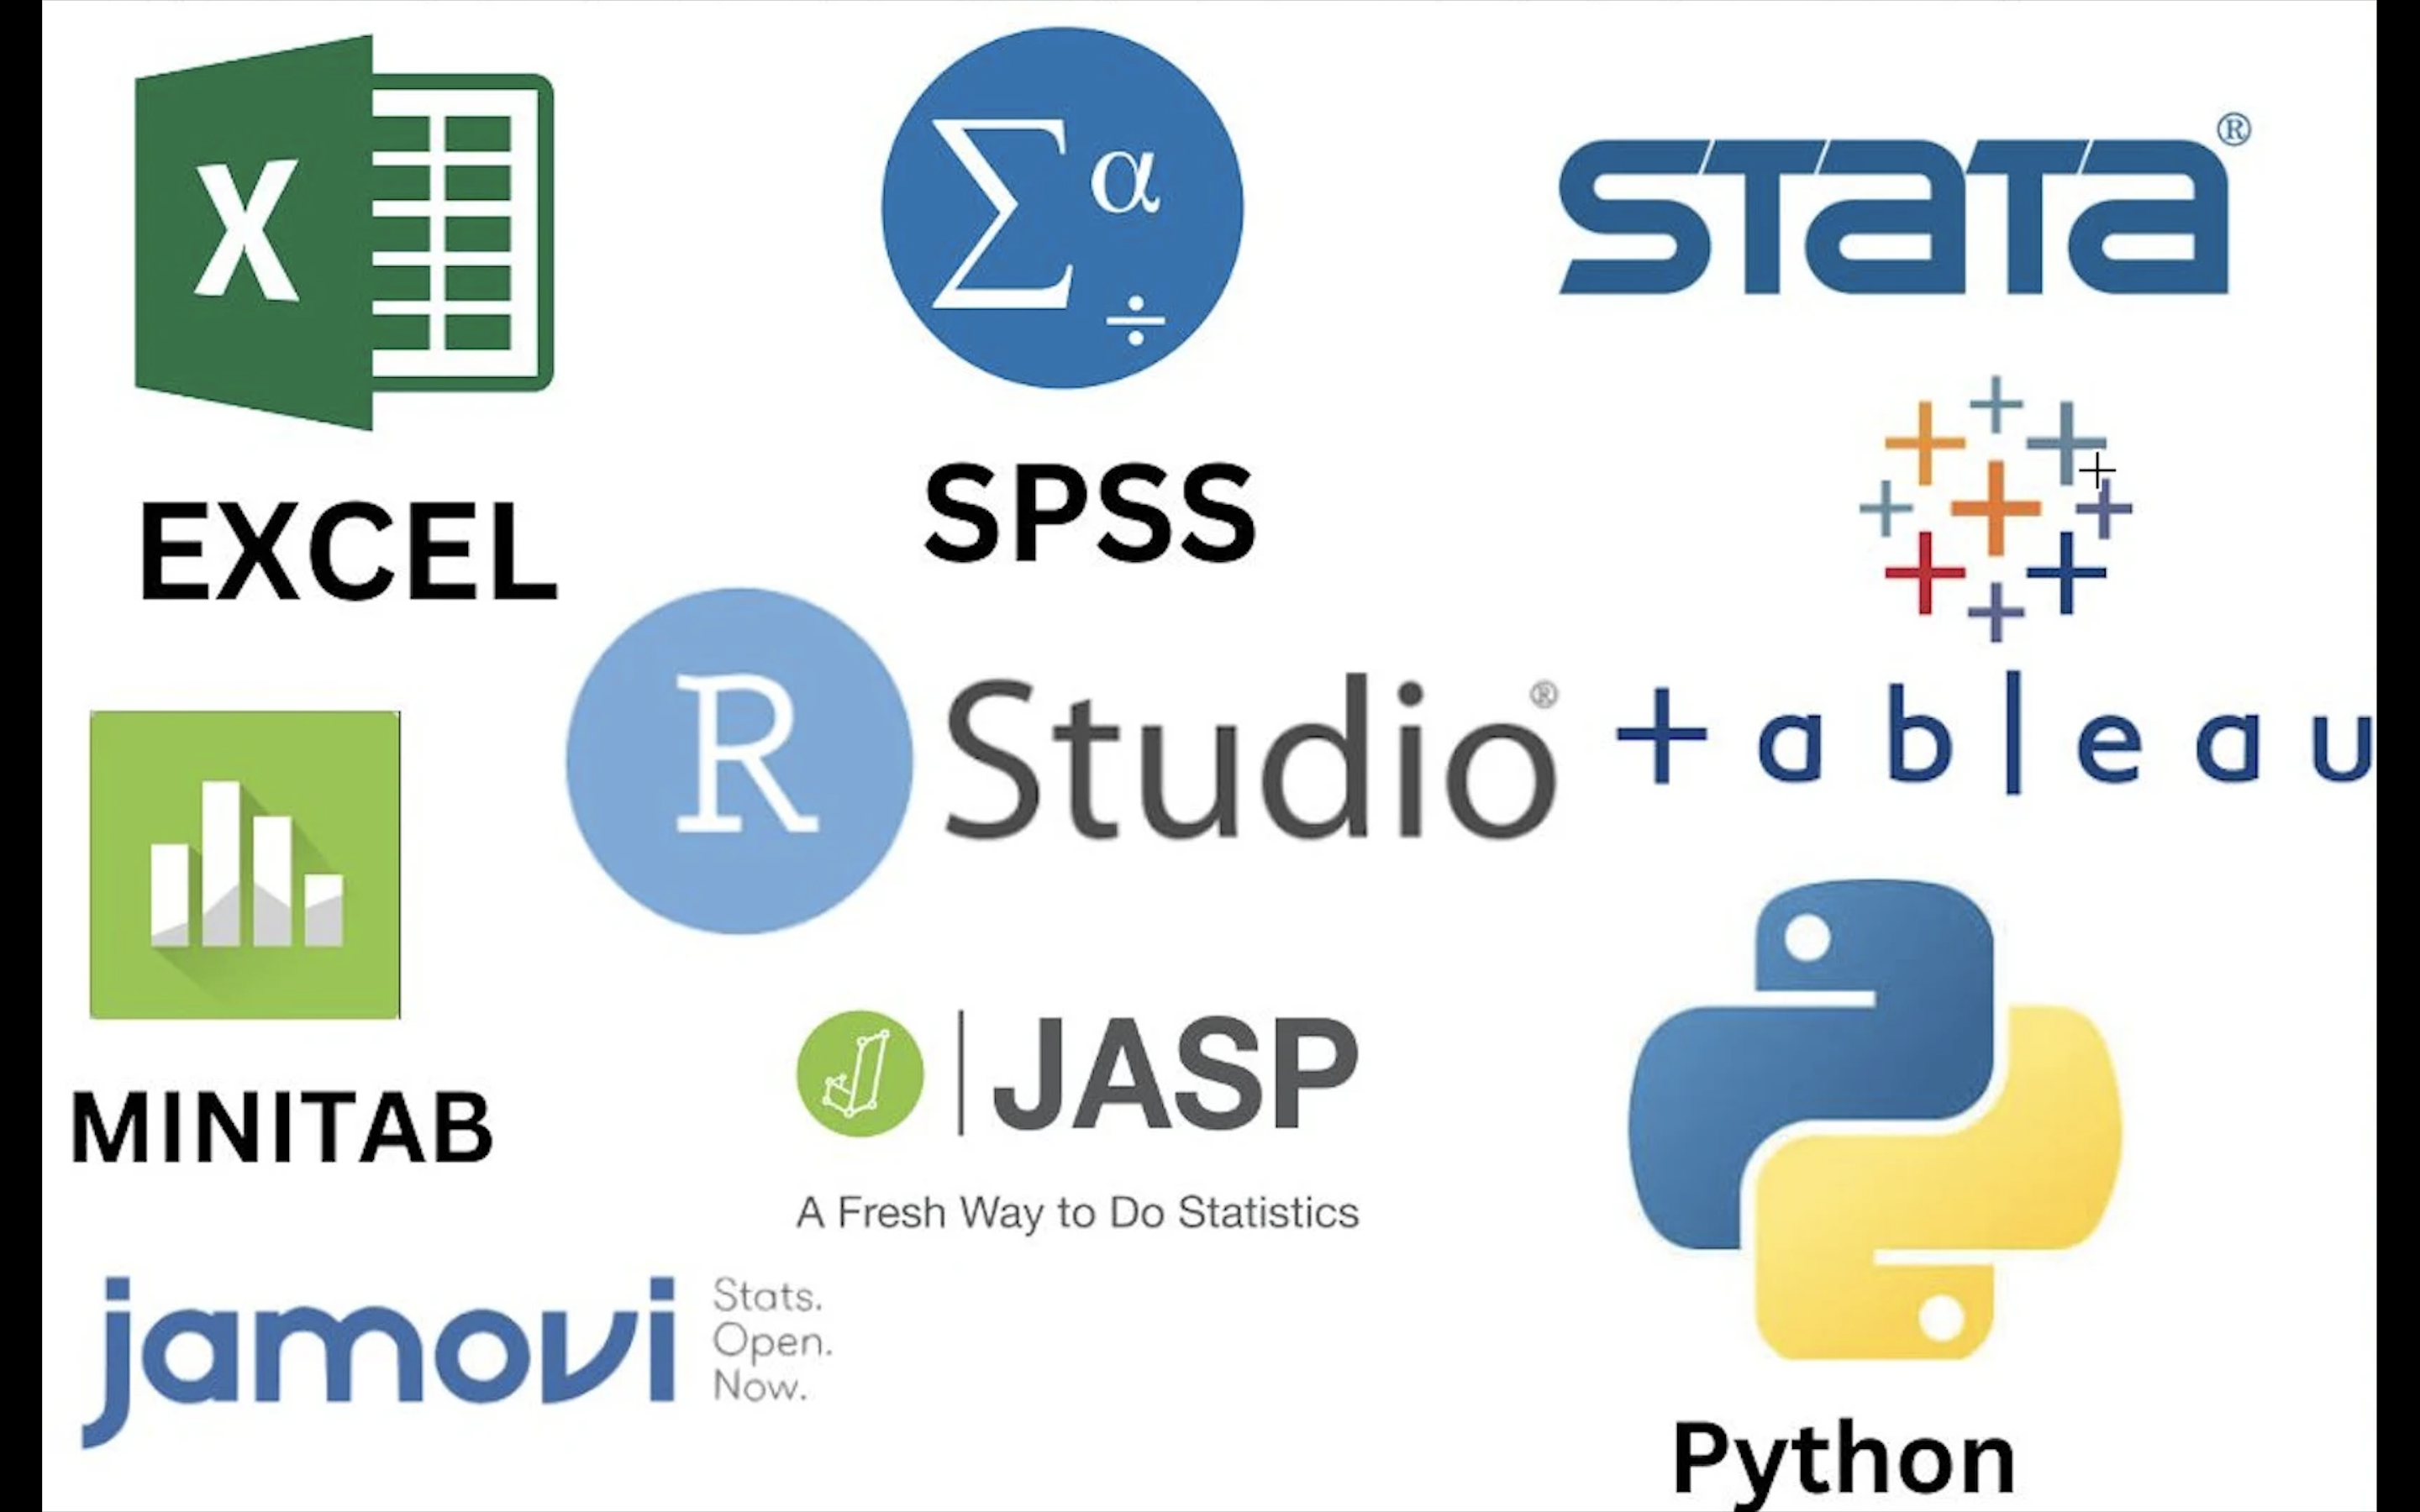
| Examples: R, Python, JASP, Jamovi | Examples: SPSS, Stata, SAS, Minitab |
2.2 Major Categories of Statistical Software
- Menu-driven software (ideal for beginners, point-and-click interfaces).
- Examples: SPSS, Minitab, JMP.
- Good for learning statistics without programming.
- Programming-based software (flexible and powerful, requires coding).
- Examples: R, Python.
- Preferred for advanced research, reproducible analysis, and data science.
- Hybrid software (combines menus with scripting options).
- Examples: SPSS, Stata, SAS.
- Allows users to work with menus while supporting syntax for automation and reproducibility.