1.4 SPSS Windows
(PSY206) Data Management and Analysis
Starting SPSS Statistics
At first, download and install the SPSS installer from the IBM SPSS website (license purchase required).
To launch SPSS Statistics on a Windows computer:
Start Menu > All Programs > IBM SPSS Statistics > IBM SPSS Statistics 31
When SPSS starts for the first time, you will see an initial dialog box.
This dialog asks you whether you want to:
- Open a recently used file, or
- Open another file from your computer, or
- Create a new file from scratch.
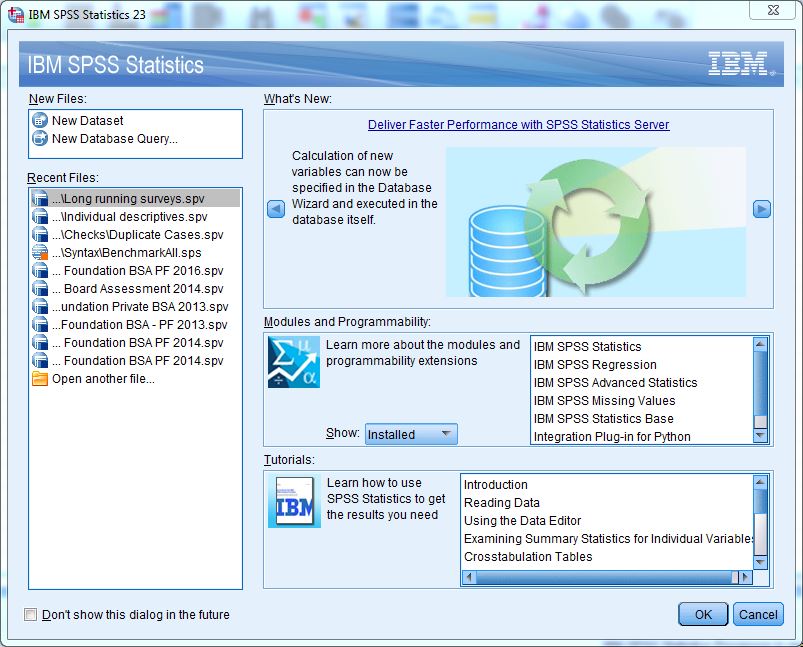
In most cases, you will begin your SPSS session by opening the data file you want to work with (for example, survey data, experimental data, or secondary datasets).
Three Main Windows in SPSS
SPSS Statistics works through three main windows, plus a menu bar at the top.
These windows allow you to:
- Enter and view your data,
- View the statistical results,
- Write or run commands.
Each of these windows is linked to a different SPSS file type.
1. Data Editor Window (.sav files)
The Data Editor is where you enter, edit, and view your dataset.
The Data Editor gives you two views of your data set: a Data View and a Variable View, selected by clicking on the appropriate tab in the lower left corner of the window.
- Data View
- Looks like a spreadsheet.
- Rows = individual cases (e.g., each respondent, household, or patient).
- Columns = variables (e.g., age, gender, income, education).
- You can type directly into cells or paste data from Excel.
- Looks like a spreadsheet.
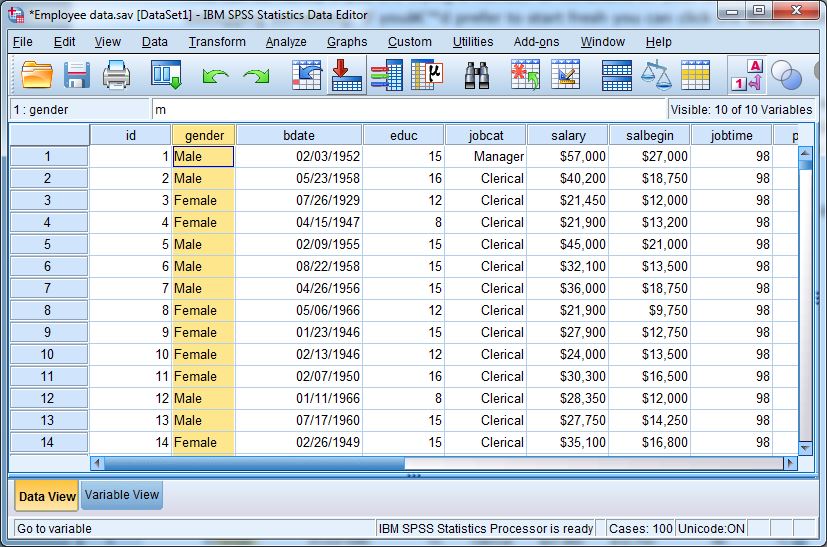
Example: If you are analyzing 100 students’ exam marks, each row represents one student, and each column represents a variable (such as ID, Gender, Exam_Score).
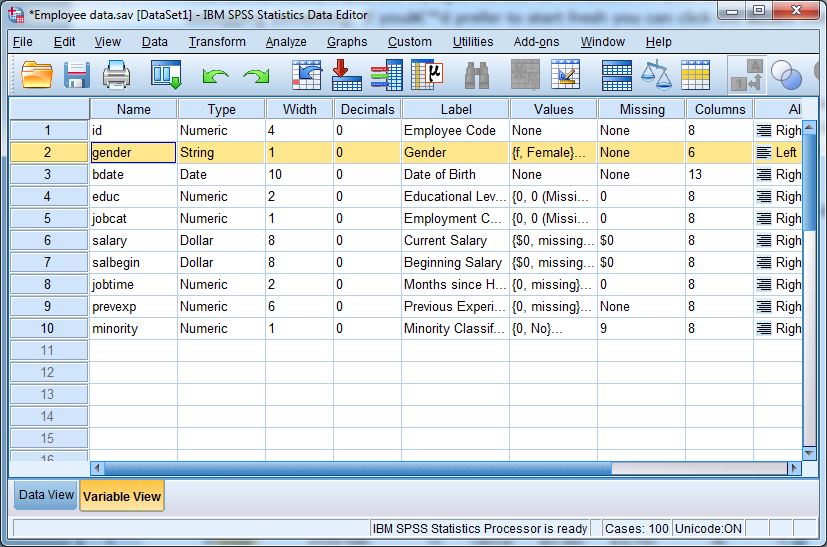
- Variable View
- Used to define and manage variables.
- Columns in Variable View include:
- Name: short name of the variable (no spaces allowed).
- Type: numeric, string, date, etc.
- Label: descriptive label for the variable.
- Values: codes and labels (e.g., 1 = Male, 2 = Female).
- Measure: nominal, ordinal, or scale.
- Name: short name of the variable (no spaces allowed).
- Important for ensuring your data is analyzed correctly.
- Used to define and manage variables.
2. Output Viewer Window (.spv files)
- This is where the results of your analysis appear.
- It includes tables, charts, and statistical test results.
- You can copy results into Word or PowerPoint for reports, or export them to PDF, Excel, or HTML.
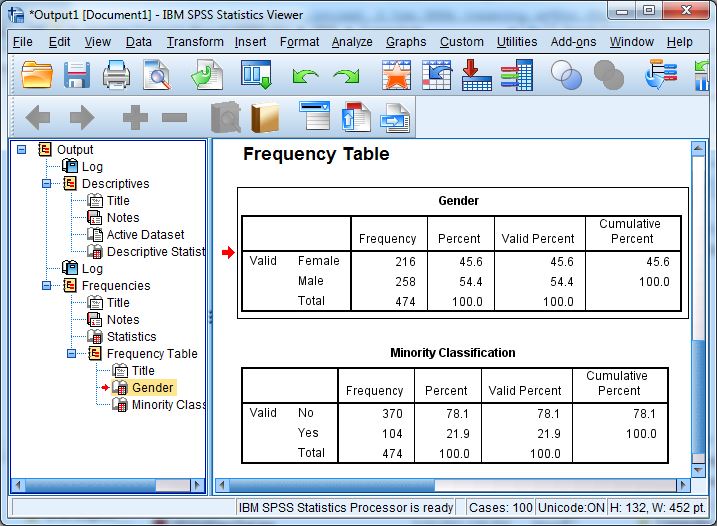
Example: After running a frequency analysis on the variable “Gender”, a table will appear in the Output Viewer showing the number and percentage of males and females.
3. Syntax Editor Window (.sps files)
- The Syntax Editor is for writing commands in SPSS language.
- Commands are saved in files ending with
.sps.
- Useful for repeating analyses without clicking menus again and again.
- Encouraged for advanced users because it ensures reproducibility.
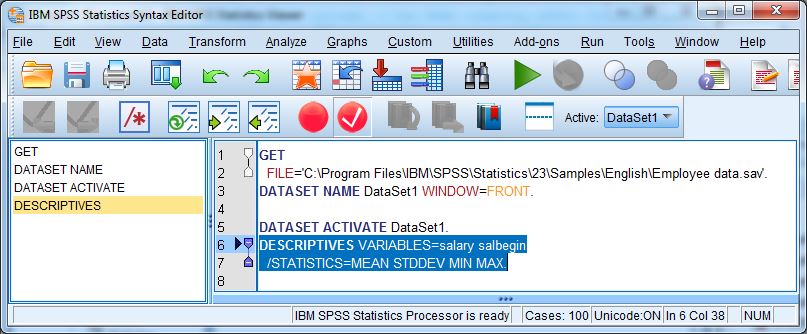
Example command:
FREQUENCIES VARIABLES=Gender.This generates the same frequency table as the point-and-click method.
Other Windows
- Chart Editor: lets you modify graphs (e.g., change colors, add titles, edit axes).
- Pivot Table Editor: allows you to reformat output tables (change fonts, merge cells, add totals).
These editors are powerful tools for preparing results for reports or publications.
Advantages of SPSS’s Window System
- Clear separation of data, metadata, and results helps you stay organized.
- Very beginner-friendly because of its graphical interface.
- Offers flexibility:
- Point-and-click menus for beginners,
- Syntax commands for advanced users and reproducibility.
- Point-and-click menus for beginners,
File Types in SPSS
| Extension | File Type | Contents |
|---|---|---|
.sav |
Data File | Contains data + variable definitions |
.sps |
Syntax File | Stores analysis commands/scripts |
.spv |
Output File | Stores results of statistical analyses |
Note: .sav files are the most commonly used. If you only save your output (.spv), you won’t be able to re-run your analysis later without the data file.
Example Exercise
Question: Match each SPSS window with its main purpose:
- Data entry and editing → ?
- Variable definition → ?
- Results display → ?
Answer:
1. Data Editor: Data View.
2. Data Editor: Variable View.
3. Output Viewer.
Summary
- The three main windows are:
- Data Editor (Data View + Variable View),
- Output Viewer,
- Syntax Editor.
- Data Editor (Data View + Variable View),
- Additional editors help with customizing charts and tables.
- The separation of data, syntax, and output makes SPSS easy to learn and reliable for research.