1.2 Statistical Software Overview
(PSY206) Data Management and Analysis
Introduction
- In modern research, as data analysis becomes larger and more complex, specialized statistical software has become essential.
- These tools help researchers and students:
- Manage and clean large datasets efficiently.
- Perform statistical tests, modeling, and predictive analysis.
- Create professional-quality graphs and formatted reports.
- Manage and clean large datasets efficiently.
- Each software package has its own strengths and weaknesses, and the choice often depends on:
- Field of study,
- Research objectives,
- Budget,
- Familiarity with coding.
- Field of study,
Major Categories of Statistical Software
- Menu-driven software (ideal for beginners, point-and-click interfaces).
- Examples: SPSS, Minitab, JMP.
- Good for learning basics and running standard analyses.
- Examples: SPSS, Minitab, JMP.
- Syntax/programming-based software (flexible and powerful, requires coding).
- Examples: R, Python, Stata, SAS.
- Preferred in advanced research and reproducible workflows.
- Examples: R, Python, Stata, SAS.
- Hybrid software (combines menus with scripting options).
- Example: SPSS (menus + syntax).
- Lets users begin with menus and gradually move to coding.
- Example: SPSS (menus + syntax).
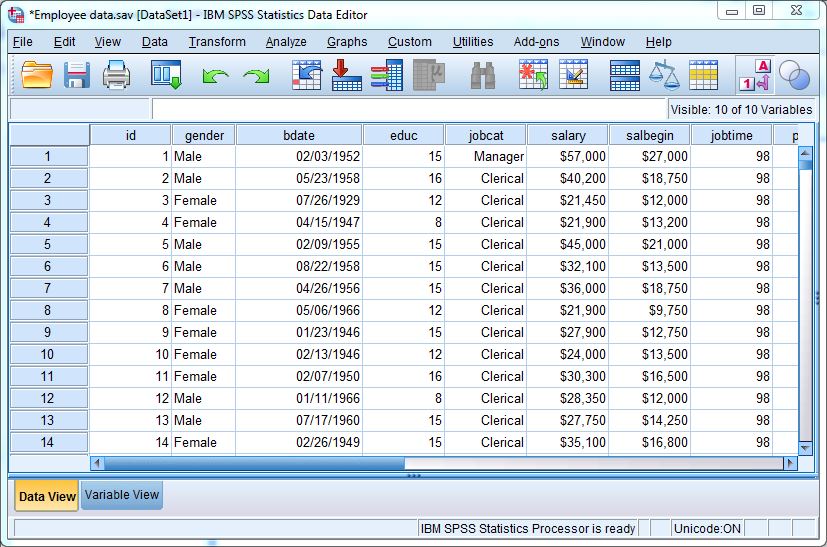
IBM SPSS Statistics
- Strengths:
- Very user-friendly with a point-and-click interface.
- Popular in social sciences, psychology, health, and education.
- Strong for: data entry, descriptive statistics, regression, factor analysis.
- Integrates easily with Excel spreadsheets.
- Very user-friendly with a point-and-click interface.
- Limitations:
- Less flexible for advanced/custom analyses.
- Expensive (licensed software).
- Slower when handling very large datasets.
- Less flexible for advanced/custom analyses.
R (Free & Open Source)
- Strengths:
- Free and open source (no license fees).
- Extremely flexible, supports almost every statistical method.
- Excellent for data visualization (e.g., ggplot2), interactive apps (Shiny dashboards).
- Huge ecosystem of packages (CRAN, Bioconductor).
- Free and open source (no license fees).
- Limitations:
- Requires programming knowledge (steep learning curve).
- Less intuitive for complete beginners.
- Needs installation and management of packages.
- Requires programming knowledge (steep learning curve).
Example: R is ideal for an academic researcher who needs advanced modeling (like survival analysis or machine learning) and is comfortable with coding.
Python (General-Purpose + Data Science)
- Strengths:
- Free and open source.
- Great for data science, machine learning, and automation.
- Libraries like pandas, NumPy, scikit-learn, TensorFlow, PyTorch make it powerful.
- Strong integration with databases, websites, and cloud platforms.
- Popular in both academia and industry.
- Free and open source.
- Limitations:
- Requires programming skills.
- Fewer ready-made built-in statistical procedures compared to R.
- Visualization requires additional libraries (matplotlib, seaborn).
- Requires programming skills.
Example: Python is widely used by tech companies for tasks like building recommendation systems, predictive modeling, and big data pipelines.
Stata
- Strengths:
- Popular in economics, epidemiology, sociology, and political science.
- Balanced between menus and scripting (easy to learn commands).
- Excellent for panel data analysis, survival models, and econometrics.
- Strong official documentation and user community.
- Popular in economics, epidemiology, sociology, and political science.
- Limitations:
- Commercial (paid) software.
- Graphics less advanced compared to R/Python.
- User community smaller than R/Python.
- Commercial (paid) software.
Example: An economist analyzing household panel data (like income and expenditure surveys) would find Stata very effective.
SAS
- Strengths:
- Industry standard in clinical trials, banking, insurance, and government.
- Extremely powerful for big datasets and regulatory reporting.
- Offers advanced modeling, business analytics, and automation.
- Industry standard in clinical trials, banking, insurance, and government.
- Limitations:
- Very expensive licensing costs.
- Complex and less intuitive for beginners.
- Declining popularity among students (due to free alternatives).
- Very expensive licensing costs.
Example: A pharmaceutical company analyzing drug trial data for FDA submission often uses SAS due to its reliability and industry acceptance.
Comparison of Statistical Software
| Software | Cost | Ease of Use | Best For | Limitations |
|---|---|---|---|---|
| SPSS | Paid | Very Easy | Social sciences, health | Expensive, limited flexibility |
| R | Free | Hard | Advanced stats, research | Steep learning curve |
| Python | Free | Medium | Data science, ML, automation | Needs programming |
| Stata | Paid | Medium | Economics, panel data | Cost, smaller community |
| SAS | Paid (very) | Hard | Pharma, industry, big data | Very expensive, complex |
Practical Guidelines for Choosing Software
- If you are a beginner/social science student: Use SPSS (easy, reliable).
- If you want free and powerful tools for research: Choose R or Python.
- If working in economics, demography, or epidemiology: Choose Stata.
- If working in pharma or large-scale industry projects: Choose SAS.
Example Exercise 1
Question: A psychology researcher wants to do descriptive statistics and regression analysis without writing code. Which software would you recommend? Why?
Answer: SPSS – It has an easy point-and-click interface, is widely used in psychology, and requires no coding.
Example Exercise 2
Question: Match the field with the most common software:
- Clinical trials in the pharmaceutical industry → ?
- Machine learning models → ?
- Teaching basic statistics in undergraduate classes → ?
Answer:
1. SAS.
2. Python (or R).
3. SPSS (or Minitab).
Summary
- A variety of statistical software packages exist: SPSS, R, Python, Stata, SAS, Minitab, JMP.
- Each has specific strengths and limitations depending on cost, ease of use, and intended purpose.
- SPSS & Minitab → Beginner-friendly, ideal for teaching and social sciences.
- R & Python → Free, flexible, excellent for research and data science, but require coding.
- Stata & SAS → Specialized for certain research and industry fields.
- Choosing the right software depends on your research field, budget, and level of technical expertise.