1.1 Word and Spreadsheet
(PSY206) Data Management and Analysis
Overview
- In data analysis, we often deal with large amounts of text, numbers, and tables.
- Two essential tools to manage these are the word processor and the spreadsheet.
- These software packages are foundational:
- Word processors help us create, format, and edit documents.
- Spreadsheets help us organize, calculate, and analyze numerical data.
- Word processors help us create, format, and edit documents.
- Before moving on to statistical software (like
SPSS,Nvivo, orMAXQDA), students must have a clear understanding of these fundamental tools.
Word Processors
- A word processor is software used for creating, editing, formatting, and printing text-based documents.
- They replaced traditional typewriters by allowing:
- Easy editing and revising of text.
- Rich formatting options (fonts, margins, headings, alignment).
- Insertion of tables, figures, footnotes, references, hyperlinks.
- Spell-checking and grammar tools.
- Easy editing and revising of text.
- Examples: Microsoft Word, Google Docs, LibreOffice Writer, Apple Pages, WPS Writer, Overleaf (LaTeX editor).
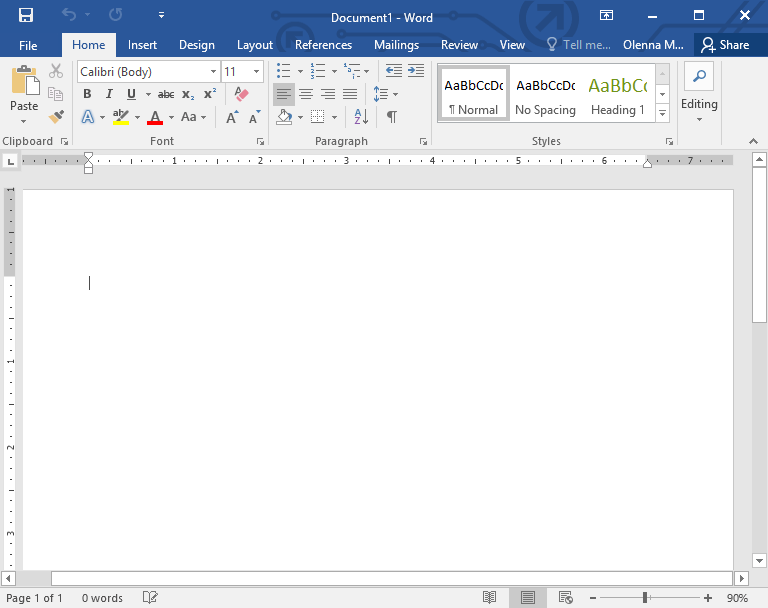
Microsoft Word
- Part of the Microsoft Office Suite.
- Features:
- Templates for reports, resumes, academic theses.
- Advanced referencing tools (citations, bibliographies).
- Track changes and comments for collaboration.
- Mail merge for generating personalized letters.
- Templates for reports, resumes, academic theses.
- Strengths:
- Professional, flexible, widely supported across industries.
- Professional, flexible, widely supported across industries.
- Limitations:
- Paid software requiring license/subscription.
Alternatives to Microsoft Word
- Google Docs – Free, browser-based, real-time collaboration.
- LibreOffice Writer – Free, offline, open-source, Word-compatible.
- WPS Writer – Free version available, Excel-like interface.
- Overleaf (LaTeX editor) – Best for academic research writing with formulas and structured formatting.
Spreadsheets
- A spreadsheet is a software application designed to organize, calculate, and analyze data in tabular form.
- Data is entered into a grid of rows and columns, forming cells.
- Each cell can contain text, numbers, or formulas.
- Spreadsheets are particularly useful for:
- Numerical analysis (budgets, statistical summaries).
- Data visualization (charts and graphs).
- Data management (sorting, filtering, and summarizing).
- Numerical analysis (budgets, statistical summaries).
- Popular spreadsheets include Microsoft Excel, Google Sheets, and LibreOffice Calc.
Introduction to Excel
- Microsoft Excel is a spreadsheet program used to store, organize, and analyze data.
- Data is arranged in rows (numbers) and columns (letters) forming cells.
- Each cell can contain:
- Text (names, labels)
- Numbers (data values)
- Formulas (calculations)
- Text (names, labels)
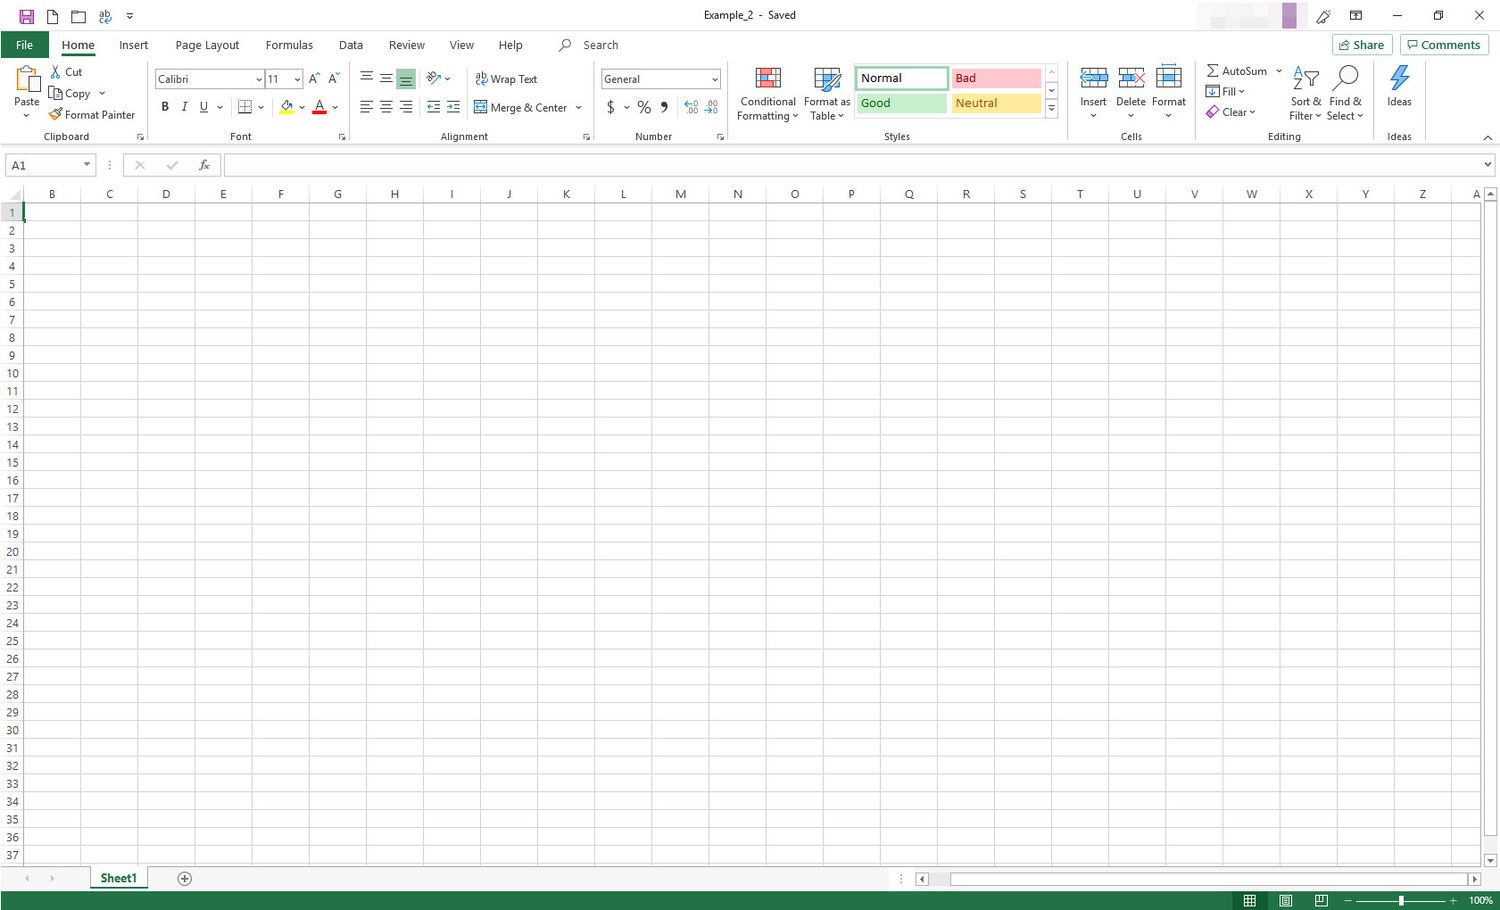
Excel Interface
- Workbook → The whole Excel file.
- Worksheet → A single tab/page inside a workbook.
- Cell → Intersection of a row and a column.
- Cell Reference:
A1= Column A, Row 1
B5= Column B, Row 5
Entering Data
- Click on a cell and type a value or text.
- Press Enter to go down, Tab to move right.
- Data types:
- Numeric: 120, 3.75
- Text: “Dhaka”, “Student”
- Date/Time: 12/09/2025, 10:30 AM
- Numeric: 120, 3.75
Basic Formulas
- Always start with
=.
- Examples:
=A1 + B1→ Adds two cells.
=A1 * B1→ Multiplies values.
=A1 - B1→ Subtracts values.
=A1 / B1→ Divides values.
Common Functions
- SUM →
=SUM(A1:A5)adds all numbers from A1 to A5.
- AVERAGE →
=AVERAGE(B1:B10)finds mean.
- MAX / MIN →
=MAX(C1:C20),=MIN(C1:C20)finds maximum and minimum. - COUNT →
=COUNT(D1:D50)counts numeric entries.
Formatting Data
- Change font, size, and color.
- Use bold/italic/underline for emphasis.
- Align text left, right, or center.
- Format numbers as:
- Currency
- Percentage
- Date
- Currency
Charts in Excel
- Select data → Insert → Choose chart type.
- Common charts:
- Column/Bar chart – compare categories.
- Pie chart – show proportions.
- Line chart – show trends over time.
- Column/Bar chart – compare categories.
Example Exercise
- Q1: Enter 5 students’ marks in Excel and calculate:
- Total marks using
SUM().
- Average marks using
AVERAGE().
- Highest mark using
MAX().
- Total marks using
- Q2: Create a bar chart of the marks.
Alternatives to Excel
- Google Sheets – Free, online, real-time collaboration.
- LibreOffice Calc – Free, offline, Excel-compatible.
- WPS Spreadsheets – Free, Excel-like user interface.
- Zoho Sheet – Cloud-based, business-oriented, integrates with Zoho apps.